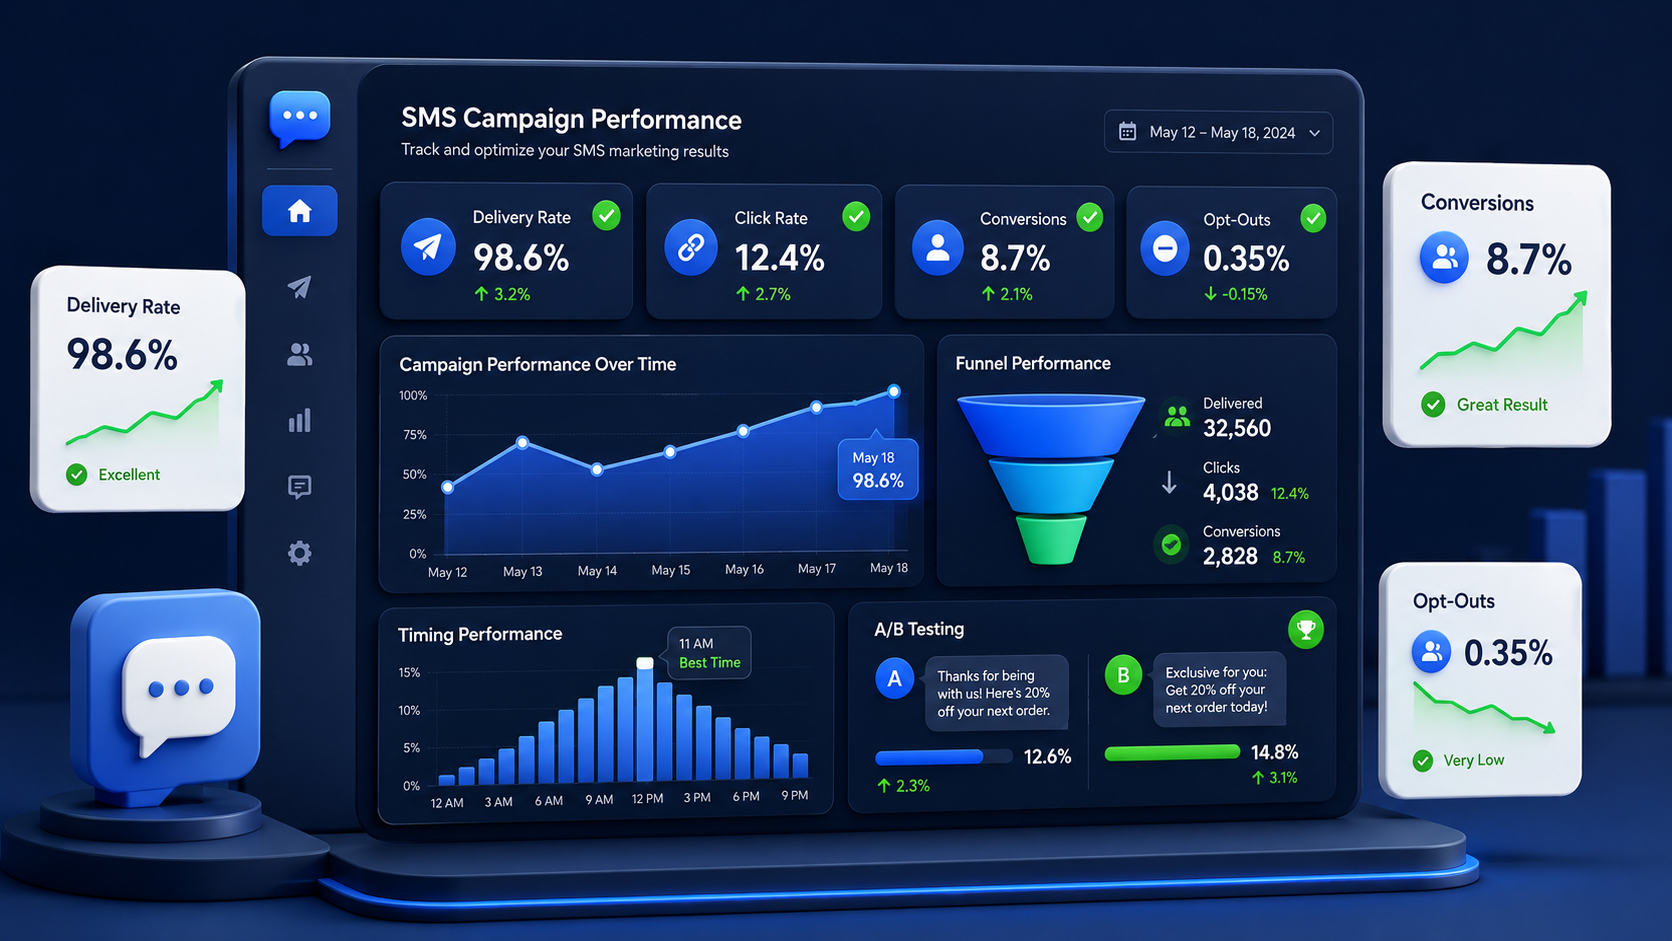
SMS growth usually doesn’t fail because of volume. It fails because teams can’t measure what SMS is actually changing. Social reach feels noisier. Paid costs keep creeping up. So SMS becomes the obvious “stable channel.” And it can be — if you can trust the numbers behind it.
Here’s the uncomfortable part: most “SMS growth” problems aren’t a volume problem. They’re a measurement problem. Not sexy. Still true. That’s exactly what we see at SMS Boosting. We work with teams who want one thing: SMS that’s reliable, respectful, and measurable.
You’ve probably seen the headline stats. “SMS has open rates of 98%.” That line gets repeated for a reason. It’s attention-grabbing. But attention alone doesn’t equal impact — especially if you can’t connect it to outcomes you trust.
If you can’t connect your sends to outcomes you trust, you’ll do one of two things: over-credit SMS (and optimize the wrong thing), or under-credit SMS (and slowly cut the budget that was actually working). Neither is growth.
The Measurement Ladder: From Delivery Signals to Incremental Revenue
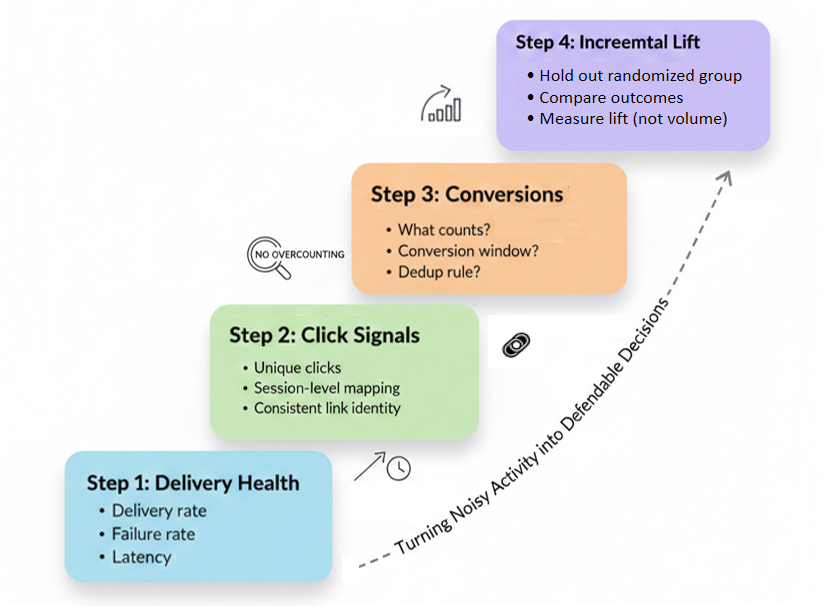
This ladder exists for one reason: to turn noisy activity into decisions you can defend. You don’t need a “perfect” attribution model to get honest measurement. You need a ladder — a sequence that turns noisy signals into reliable business answers.
Step 1 — Delivery health (and why latency is a growth metric)
Delivery is not a technical detail. It’s the start of the customer experience — and the first place measurement quietly breaks without anyone noticing.
Track:
- Delivery rate (delivered / sent)
- Failure rate (hard fail vs temporary fail)
- Latency (p50 and p95 “time-to-deliver”)
If latency drifts, your “timing test” is no longer a timing test. It’s a routing test you didn’t mean to run.
Step 2 — Click signals you can trust (without inflating performance)
Clicks are useful — and easy to overcount.
Prefer:
- Unique clicks over total clicks
- Session-level click mapping (one click → one session)
- Consistent link identity (so you can compare apples to apples)
And yes, you’ll still have “dark conversions” — people who read the message, don’t click anything, then show up hours or days later and convert anyway. That’s why clicks are step 2, not the finish line.
Step 3 — Conversions that aren’t double-counted
Define conversions with rules you can defend:
- What counts as a conversion? (purchase, signup, checkout-start)
- What is the conversion window?
- What is the dedup rule if a user touches multiple channels?
If you don’t define this up front, your post-campaign readout becomes a negotiation.
Step 4 — Incremental lift: proving what SMS actually caused
Attribution tells you “who got credit.” Incrementality tells you “what changed because of SMS.”
The simplest path:
- hold out a small randomized group (even 5–10%)
- compare outcomes inside the same time window
- measure lift, not just volume
Not glamorous. Extremely clarifying. And in practice, often the fastest way to stop internal attribution debates.
How to Set Up Measurable SMS Link Tracking?
This is the “minimum viable” setup to make SMS measurable without turning your team into a data engineering department.

Source: Designed by Freepik
Choose a link strategy: short links, deep links, or both
- Short links: clean, trackable, flexible, great for web flows
- Deep links: best for app experiences, harder to standardize
- Hybrid: short link → smart redirect to deep link when possible
- Rule of thumb: start with short links for measurement clarity. Add deep links when UX demands it.
A UTM naming system that survives scale (and human mistakes)
Your UTM system should be boring. Predictable. Machine-readable.
Use a stable base:
utm_source=sms
utm_medium=sms
utm_campaign=… (the only field that should change every time)
Then encode meaning inside utm_campaign using a consistent pattern.
Example pattern (pick one and stick to it):
YYYY-MM_region_offer_audience_variant
2026-01_US_winter-sale_vip_v1
Keep it short. You want analysts to read it and ops teams to type it without inventing new formats.
Define the conversion window Before the Debate Starts
Pick a default window by campaign type, then adjust when you have evidence.
Common starting points:
- flash offer/urgency: 2–6 hours
- standard promo: 24 hours
- high-consideration purchase: 3–7 days
Write it down. Use it consistently for 4 weeks. Then revisit with data — not opinions.
Dedup rules: what counts as “SMS-driven”
You need one clear rule to prevent double-credit with paid + email.
A practical default:
- If the user clicks an SMS link, SMS gets credit only if conversion happens within the campaign window.
- If the user converts without clicking, SMS gets no direct attribution — that’s what incrementality is for.
This will feel “unfair” to SMS. Good. You’re reducing self-deception.
The Minimum Viable Template: UTM Builder + Dashboard Fields
Here’s a simple template you can copy into a spreadsheet or internal doc.
Copy/paste UTM structure (campaign, content, audience, offer)
Use a single “campaign key” that you reuse everywhere (links, dashboards, postmortems).
Campaign key example
2026-01_US_winter-sale_vip_v1
URL example
https://example.com/winter?utm_source=sms&utm_medium=sms&utm_campaign=2026-01_US_winter-sale_vip_v1&utm_content=hero&utm_term=vip
Keep utm_content and utm_term optional. If your team can’t keep them consistent, don’t pretend.
Minimum event taxonomy: the smallest set that still works
You don’t need 40 events. You need a few clean ones.
Start with:
- sms_link_click (unique)
- landing_view
- key_action (signup / add_to_cart / checkout_start)
- conversion (purchase / subscription)
- opt_out (if applicable)
Make sure each event captures: timestamp, user identifier, campaign identifier, country/region, and message type.
Pre-flight QA: what to validate before sending
Before every campaign (yes, every one), test:
- link resolves correctly (no redirect loops)
- UTMs are attached and visible in analytics
- landing page loads fast on mobile
- conversion event fires as expected
- segment size matches expectations
- send timing is correct for target region
This is where “measurable” is either real… or imaginary. Most teams lose accuracy here, not in the dashboard.
Midway tip (soft): If you want, SMSBoosting can share a one-page UTM + scorecard template to standardize naming and weekly reporting across the team.
Dashboard Fields That Actually Map to Business Outcomes
At minimum, track these per campaign key:
- sends
- delivered
- delivery rate
- latency p95
- unique clicks
- click-to-conversion rate
- conversions
- revenue (if available)
- opt-out rate
- complaint/support signals (if you can capture them)
This bridges marketing and ops. That’s the point.
A One-Screen Weekly View — From Reporting to Decisions
Your weekly dashboard should answer:
- What grew?
- What broke?
- What changed that explains it?
- What will we test next?
If it can’t answer those, it’s reporting — not measurement.
How to Read SMS Numbers Without Lying to Yourself?

Source: Designed by Freepik
A 5-Minute Reality Check — Can You Explain Last Week’s SMS Impact?
Try this with your current dashboard. Five minutes. No spreadsheets. No “we’ll pull it later.”
If your SMS dashboard is doing its job, it should clearly answer three questions:
1. What did SMS change? (revenue, conversions, retention, support load — pick one)
2. How do you know it was SMS? (not email, not paid retargeting, not “they would’ve bought anyway”)
3. What will you do differently next week? (timing, audience, offer, routing, frequency)
If you can’t answer all three, your SMS program may still be “good”… but it’s not controllable. It’s vibes.
Attributed vs Incremental Conversions
The two numbers most teams can’t reconcile:
- Attributed conversions (what analytics assigns)
- Incremental conversions (what SMS caused)
You can have a ton of the first and very little of the second. That’s not a rounding error — it changes decisions, budgets, and what your team thinks is actually working.
Common Failure Modes That Steal Credit
Watch for:
- paid retargeting capturing the click later
- email already warming the user
- repeat buyers who would convert anyway
- “brand search” spikes that steal credit
None of this means SMS is bad. It means measurement is hard.
Thresholds and Baselines — How to Keep Optimization Honest
Pick baseline expectations for:
- delivery rate floor
- latency p95 ceiling
- opt-out rate ceiling
- click quality (unique clicks / delivered)
- conversion efficiency (conversion / unique click)
Then alert on drift. Not perfection. Drift.
The Weekly SMS Scorecard: 10 Metrics That Predict Business Impact
This is not your full dashboard. It’s the subset you should actually look at every week. You don’t need 50 metrics. You need 10 that actually change what you do next week.
Delivery health metrics (the ones ops and marketing both need)
- delivery rate
- failure rate (by reason)
- latency p95
- route/carrier variance (where performance shifts)
Engagement quality (what to keep, what to ignore)
- unique click rate (per delivered)
- landing page bounce rate (SMS traffic only)
Open rate gets the headlines. But it rarely tells you what to do next.
Conversion efficiency (where ROI actually moves)
- click-to-conversion rate
- conversion value per delivered (or per click)
Business signals (revenue, churn, support tickets)
- incremental lift estimate (from holdout tests when possible)
- negative signals (opt-outs, complaints, support friction)
Remember this line (it’s blunt, but useful): “More messages” is a tactic. Measurement is a system.
Where SMS Boosting Fits — Measurement and Reliability Together
This is the part most teams miss: measurement and reliability are not separate workstreams.
At SMS Boosting, our north star is simple — make every message secure, efficient, and actually valuable to the business (not just “sent”).
Marketing SMS — Permission, Timing, Proof
Marketing SMS works when timing and permission matter more than volume. Measurement keeps it respectful — and profitable.
Transactional SMS — Reliability as Product Experience
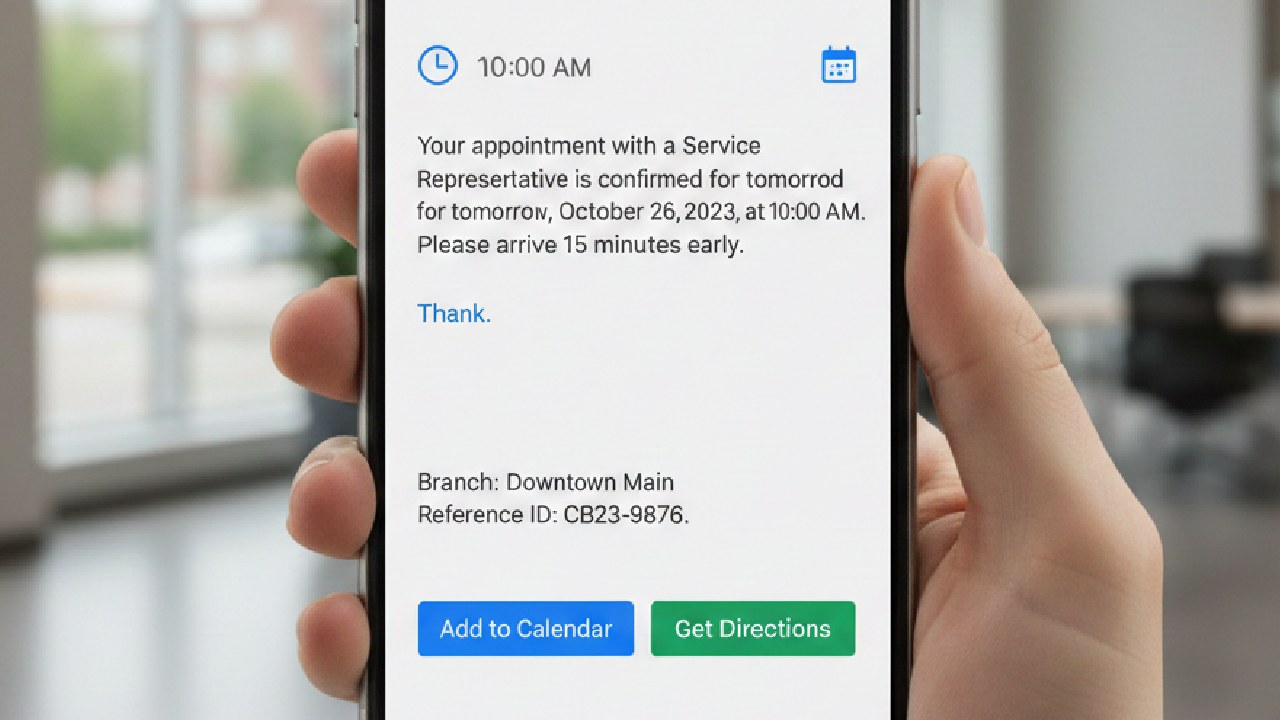
If your order updates arrive late (or not at all), the “product experience” takes the blame. Your measurement should expose that, not hide it.
OTP / 2FA SMS — Success Rates Without Letting It Hijack the Story
OTP/2FA needs dependable delivery. Track success rates and latency. But don’t let OTP become your entire narrative if the business goal is growth.
Conclusion
One last reminder from the seasonality playbook: Growth doesn’t come from shouting. It comes from clarity.
If you want a fast way to get that clarity — especially if your SMS program already looks “good” but still feels hard to control — SMS Boosting can do a lightweight review of:
- your link + UTM setup
- your conversion window + dedup rules
- your delivery health signals (latency, failures, variance)
- your weekly scorecard (what’s missing, what’s noise)
You’ll leave with a short action plan and a prioritized “fix first” list. No theater. Just the boring stuff that makes SMS scalable.
And if you’re worried about over-messaging, you’re not alone. That’s exactly why measurement matters. It protects the customer experience while still pushing growth. Because, honestly: Customer engagement is bigger than sales—most moments with customers have nothing to do with a transaction.
FAQs
What if people convert without clicking?
They will. That’s normal. Don’t force attribution to pretend you know what happened. Use incrementality tests to estimate lift.
Does this measurement framework apply to SMS marketing and OTP SMS?
Yes — but the signals you prioritize change. Marketing SMS focuses on incrementality and downstream outcomes, while OTP SMS prioritizes delivery success rate and latency. The ladder stays the same; what you optimize at each step does not.
Do open rates matter at all?
They can be a directional “is anything broken?” signal. They’re rarely a “how do we grow?” signal.
How do I compare campaigns across countries and carriers?
Standardize your campaign key, track performance by region/carrier, and watch latency + failure rate shifts. Your “best” creative may just be your “best route sees fewer delays.”
What changes when routing/deliverability shifts?
Everything downstream: timing tests, offer tests, even opt-out rates. That’s why delivery health belongs in the same dashboard as revenue.