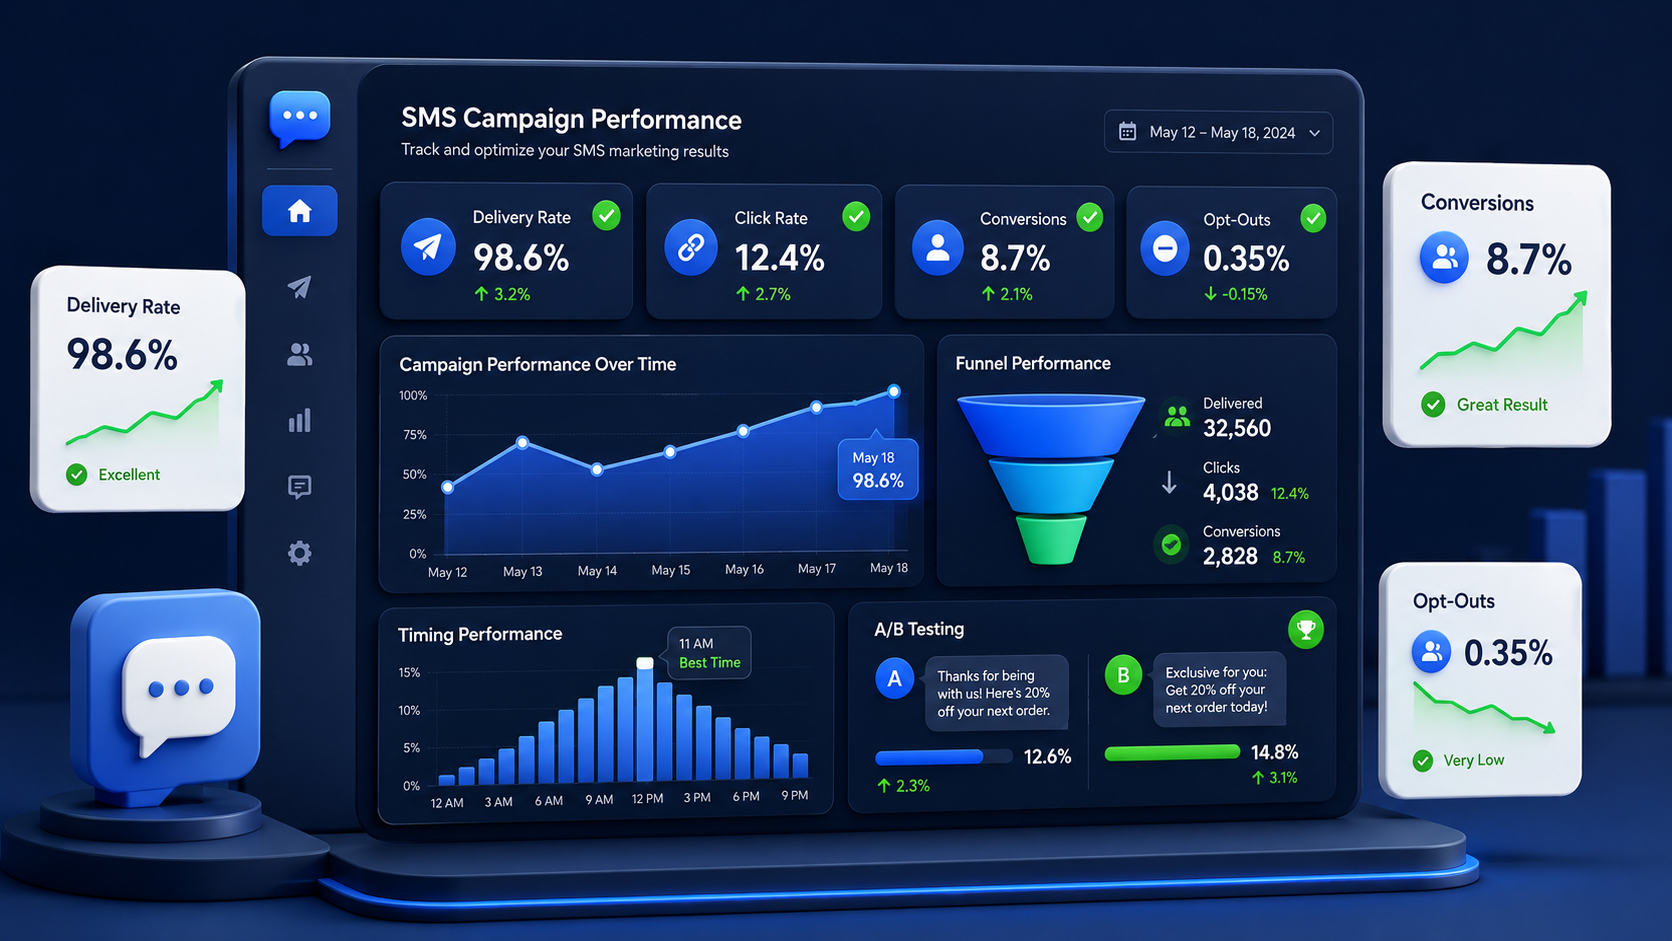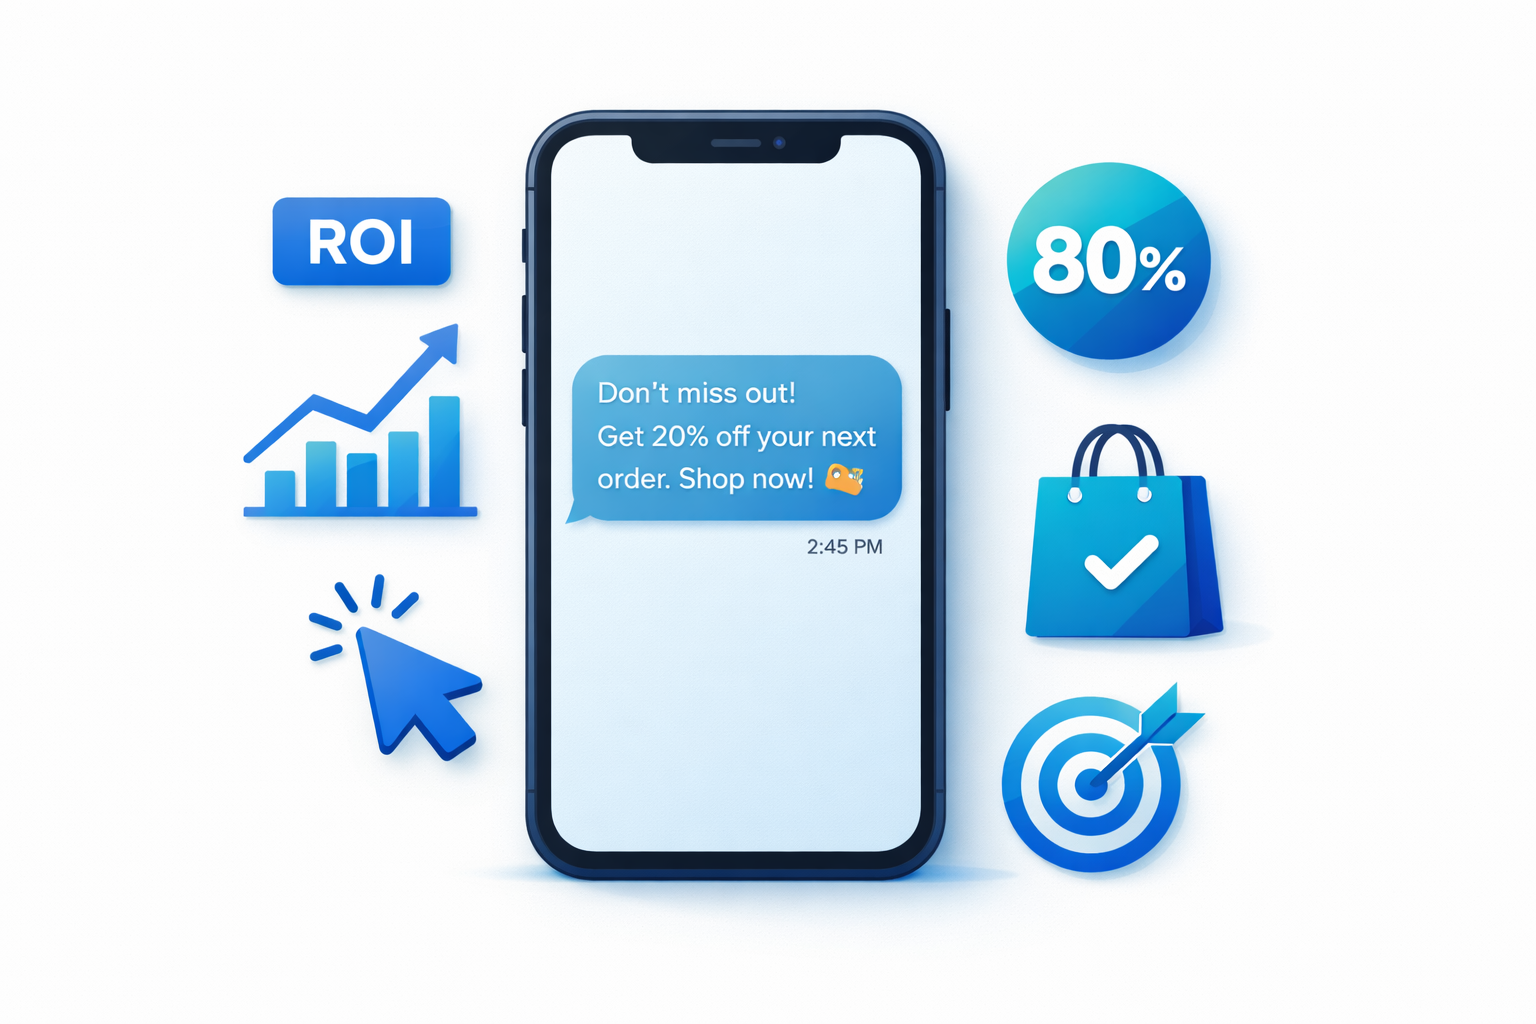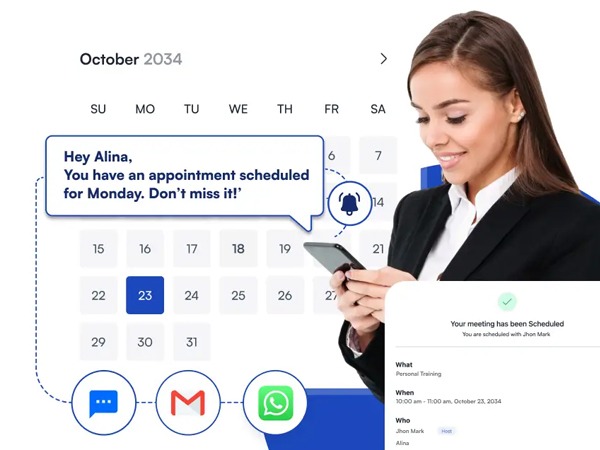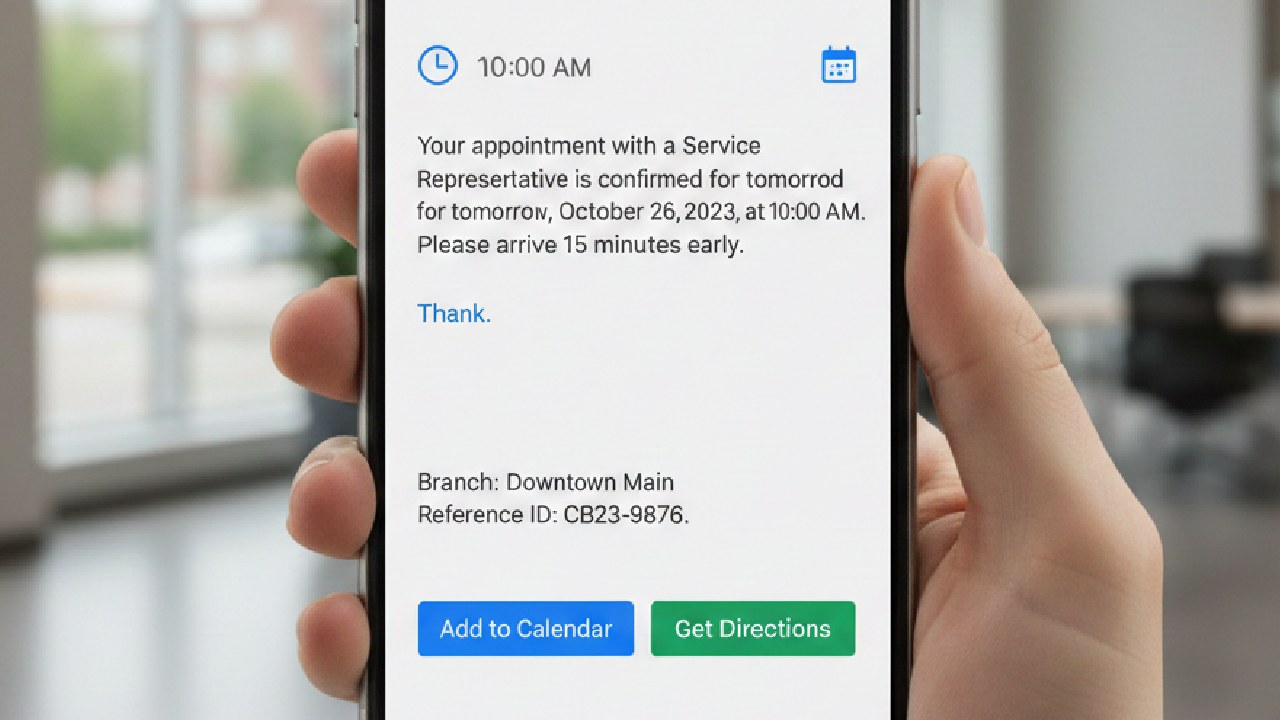
There is no true, trackable “open rate” for SMS marketing. The commonly quoted 95–98% figure is not an open rate—it’s a delivery estimate.
Unlike email, SMS messages do not contain tracking pixels or read signals. Once a text is delivered, there is no technical way to know whether it was opened or ignored.
This gap is why SMS marketing is often described as having a “98% open rate.” It sounds impressive, but it reflects message delivery, not reader engagement.
In this guide, we’ll explain where the SMS open rate myth comes from, why it’s misleading, and which metrics—like click-through rate, replies, and revenue per message—actually show whether your SMS campaigns are working.
What’s a Typical SMS Marketing Open Rate?
There is no true “open rate” for SMS marketing. The widely quoted 95–98% figure refers to message delivery, not confirmed reads or engagement.

Source: Vecteezy
You’ll often hear “SMS has a 98% open rate” repeated in vendor materials and case studies. The number sounds impressive, but it simply means the message reached a recipient’s phone—not that it was opened, read, or acted on.
If you also want to understand why a strong delivered percentage can still hide a weak user experience, read SMS reliability vs delivery rate, where we break down why delivered does not always mean on time, consistent, or operationally healthy.
This benchmark varies widely because it bundles many different factors into a single, misleading number:
- Industry Context: Flash sales and order confirmations feel more “urgent” than promotional broadcasts, which inflates perceived engagement.
- Region And Regulations: Stricter opt-in rules (such as in the U.S.) usually produce cleaner lists and higher delivery rates.
- List Quality: Fresh, permission-based lists often deliver above 95%, while older or purchased lists can drop below 70%.
- Message Type: Transactional messages are expected and opened quickly. Promotional messages compete for attention.
- Frequency And Timing: Infrequent, well-timed messages perform better than constant broadcasts.
Because these variables are rarely disclosed, published “open rate benchmarks” often conflict with each other—and none of them represent actual reads.
What People Really Mean by “Open Rate” in SMS?
In SMS marketing, the term “open rate” is used to describe three different metrics—even though only one of them is actually measurable.
- Delivery Rate (What Platforms Report): The message reached the recipient’s carrier or device. This is what most SMS tools mean when they claim “95–98% open rates.”
- Estimated Read Rate (What Marketers Assume): An assumption that delivered messages were read, often based on surveys or industry averages—not tracking.
- Engagement Rate (What You Can Measure): Clicks, replies, or conversions. This is the only category backed by real user behavior.
The problem is that vendors usually talk about delivery, while marketers hear engagement. This mismatch leads teams to overestimate performance and make poor decisions.
Can You Actually Track SMS Open Rates?
No. SMS does not support true open tracking. There is no technical method to confirm whether a text message was opened or read.
Email open tracking works because emails can load invisible tracking pixels. SMS messages cannot. They are plain text, with no embedded images, scripts, or read signals. Once a message is delivered, tracking stops.
Mobile carriers also do not share read data. SMS is treated as basic infrastructure, not a marketing channel with engagement reporting. As a result, any claimed “SMS open rate” is based on assumptions—not measurement.
What you can track are indicators of engagement:
- Click-Through Rate (CTR): Clicking a link proves the message was read and acted on.
- Reply Rate: A reply is direct confirmation of engagement.
- Conversion Rate: Purchases, bookings, or form submissions show real impact.
- iMessage And RCS Read Receipts: Available only on supported devices and settings. These are inconsistent and should not be treated as a standard metric.
The takeaway is simple: SMS open rate cannot be measured. Engagement can. That’s where meaningful analysis should focus.
Better Metrics to Use Instead of SMS Open Rate (What to Track)
If you stop tracking open rate, you need a clear replacement. The most effective SMS programs measure three categories of metrics: delivery health, engagement, and business impact. Each answers a different question—and confusing them leads to bad decisions.

Source: Vecteezy
Below are the metrics that actually matter, and how to use them correctly.
Baseline Health Metrics (System Reliability)
These metrics tell you whether your SMS program is functioning properly. They don’t measure success—but without them, nothing else matters.
Delivery Rate
Delivery rate shows whether your messages reached recipients’ phones. It is not a performance metric. It’s a system health check.
- Target:
- Marketing SMS: 95%+
- Transactional SMS: 99%+
- What it indicates: List quality, carrier filtering, and compliance health
- Red flag: Below 90% usually means recycled numbers, poor opt-in practices, or spam filtering
Your SMS platform should report delivery automatically. Track it over time. Sudden drops are warning signs, not optimization opportunities.
Opt-Out Rate
Opt-out rate measures how many recipients unsubscribe after receiving a message.
- Healthy: <0.3% per campaign
- Warning: >0.5%
- Critical: >1%
Rising opt-outs usually signal one of three issues: sending too frequently, weak targeting, or unclear opt-in expectations.
Complaint Rate
Complaint rate reflects how often recipients report your messages as spam.
- Acceptable: <1 complaint per million messages
- Risk zone: Anything higher
Complaints are often invisible until carriers start filtering your traffic. Treat this metric as an early-warning system.
Engagement Metrics (Message Interaction)
Engagement metrics show whether people are actually paying attention to your messages.
Click-Through Rate (CTR)
CTR is the most reliable indicator that a promotional SMS was read and considered.
- Typical range: 5–15% for well-segmented lists
- Excellent: 15–25%
- Weak performance: Below 3%
CTR directly influences downstream revenue. In many campaigns, a 1% increase in CTR leads to a 2–3% increase in total revenue.
Reply Rate
Reply rate measures direct interaction and matters most for two-way or conversational SMS, not broadcast promotions.
- Typical range: 5–15%
- Strong engagement: 20%+
- Low engagement: Below 2%
If your goal is support, lead follow-up, or surveys, reply rate is your primary engagement KPI.
Business Impact Metrics (Revenue & ROI)
These metrics answer the only question that ultimately matters: Is SMS driving real business results?
Conversion Rate
Conversion rate shows how many recipients complete a desired action after clicking or replying.
- Typical range: 2–5% of clicks convert
- Context matters: Flash sales convert differently than appointment reminders
Revenue Per Message (RPM) — North Star Metric
Revenue per message connects SMS activity directly to profit.
Formula:
Total SMS-driven revenue ÷ Total messages sent
Example:
If you send 100,000 messages and generate $30,000 in revenue, your RPM is $0.30.
At a $0.02–$0.05 cost per message, that’s a 6×–15× ROI.
If you track only one metric, track RPM. Everything else supports it.
How These Metrics Work Together
Each metric answers a different question:
- Delivery rate: Is the system healthy?
- CTR / reply rate: Are people paying attention?
- Conversion rate & RPM: Is SMS worth the cost?
- Opt-outs & complaints: Are you pushing too hard?
SMS open rate answers none of these reliably.
Benchmarks by Use Case, Which Metrics Matter Most?
Not all SMS messages are designed to do the same job. Promotional, transactional, and two-way SMS each serve different purposes—and judging them by the same metrics leads to misleading conclusions.
Below is how to evaluate performance by use case.
| Use Case | Primary Metrics | Typical Targets | Why These Matter |
| Promotional SMS (sales, offers) | CTR, Conversion Rate, RPM | CTR 5–15%, Conv 2–5%, RPM $0.10–$1.00 | Revenue generation |
| Transactional SMS (notifications, reminders) | Delivery Rate, Complaint Rate | Delivery 99%+, Complaints <1/million | Reliability & trust |
| Two-Way SMS (support, lead follow-up) | Reply Rate, Response Time | Reply 5–20%, Response <2 hrs | Engagement quality |
i) Promotional SMS (Sales, Offers, Flash Deals)
Primary goal: Drive clicks and revenue.
Focus on CTR and conversion rate. CTR confirms the message earned attention. Conversion proves it delivered value.
- Healthy performance: 5–15% CTR, 2–5% conversion
- Strong performance: 10%+ CTR with consistent RPM growth
Ignore “open rate.” If people click and buy, the message worked.
ii) Transactional SMS (Notifications, Reminders)
Primary goal: Reliable delivery and a smooth customer experience.
These messages are expected, not persuasive, so engagement metrics matter far less than reliability.
- What to track: Delivery rate and complaint rate
- Benchmarks: 99%+ delivery, near-zero complaints
Low CTR does not signal failure in transactional SMS. Missed or delayed deliveries do.
Security-focused messages—such as OTP SMS—follow a different performance logic altogether, where speed and successful verification matter more than engagement metrics.
iii) Two-Way SMS (Support, Lead Follow-Up)
Primary goal: Conversation and resolution.
Reply rate tells you whether recipients are willing to engage, while response time determines trust.
- Healthy reply rate: 5–20%
- Strong programs: Respond within 2 hours
- Success indicator: 10–25% of replies convert to a meaningful action
For two-way SMS, reply quality matters more than raw volume.
How to Use These Benchmarks Correctly
Benchmarks provide context—not targets.
A luxury brand may see lower CTR but higher conversion. A discount retailer may see the opposite. Judge performance against your use case, not industry averages.
If clicks, replies, or revenue improve over time, your program is working—regardless of what generic benchmarks suggest.
What Affects SMS Read/Engagement Rates the Most?
SMS engagement doesn’t improve by tweaking one small thing. It improves when the right factors are fixed in the right order. Some variables matter far more than others—and ignoring that hierarchy leads to wasted effort.
Below are the factors that most strongly influence SMS engagement, ranked by impact.
Opt-In Quality (Highest Impact)
Opt-in quality is the single biggest driver of SMS engagement.
A subscriber who explicitly agrees to receive a specific type of message is far more likely to read and act on it.
- High-quality opt-in: “Yes, send me weekly flash sale alerts.”
- Low-quality opt-in: “Receive updates.”
Clear expectations reduce opt-outs, increase CTR, and protect deliverability. Weak opt-ins undermine every metric downstream.
List Freshness and Segmentation
Old numbers bounce. Dormant subscribers ignore messages. Fresh, segmented lists perform. Segment by behavior, not just demographics:
- Recent buyers
- Abandoned carts
- High-intent browsers
- VIP customers
Well-segmented campaigns often achieve 2–3× higher CTR than full-list broadcasts.
Sender Identity and Trust
People engage with messages they recognize.
Clear sender identification builds trust and reduces hesitation. If recipients have interacted with you before—or recently purchased—they are far more likely to read and click.
Unfamiliar numbers and vague sender IDs reduce engagement, even with strong offers.
Frequency and Timing
Frequency affects opt-outs. Timing affects attention.
- Send too often, and people unsubscribe.
- Send too rarely, and people forget who you are.
Lunch breaks (11 a.m.–1 p.m.) and early evenings (6–8 p.m.) often perform well, but audience behavior matters more than general rules. Test and adjust.
Message Relevance and Offer Strength
Generic messages get ignored. Relevant messages get clicks.
Tie messages to user intent:
- Browsed a product → send a related offer
- Abandoned a cart → send a reminder with context
Relevance improves CTR more reliably than clever copywriting alone.
Links, Landing Pages, and Tracking Setup
Engagement doesn’t stop at the click.
Specific CTAs outperform vague ones, and landing pages should match the message promise. Sending traffic to a generic homepage almost always reduces conversion.
Use proper UTM tracking so you can attribute results accurately and learn what’s working.
How to Improve SMS Marketing Performance (Practical Playbook)
Improving SMS performance isn’t about doing everything at once. It’s about fixing the right things in the right order.
Use the steps below as a practical execution sequence, not a checklist.
Fix Opt-In Clarity and Expectations
Start here. Poor opt-in foundations undermine everything else.
Be explicit about what subscribers will receive:
- “Weekly flash sales”
- “Order updates and delivery alerts”
Send a welcome message immediately after opt-in. This confirms consent, builds trust, and gives you your first engagement signal.
Segment Before You Scale
Do not send the same message to your entire list. Create simple behavioral segments:
- Recent buyers
- Abandoned carts
- High-intent browsers
- VIP customers
Segmented campaigns consistently outperform full-list broadcasts, often by 2–3× CTR.
Prefer Triggered Flows Over Batch Blasts
Triggered messages react to user behavior. That’s why they work. High-performing flows include:
- Welcome flow: Immediate welcome + follow-up on day 3
- Abandoned cart flow: Reminder at 4 hours, final nudge at 24 hours
- Back-in-stock alerts: Sent when intent is highest
These flows run automatically and usually generate the highest ROI.
Use a Simple, Scannable Message Structure
SMS is skimmed, not studied. Keep messages concise and structured:
- Clear hook
- One primary CTA
- Brand identification
- Opt-out instruction
Long messages often get split into multiple segments. Many recipients only read the first one.
Test One Variable at a Time
Avoid changing copy, timing, and offers all at once. Run focused tests:
- Same audience, different copy
- Same offer, different timing
Test over 2–4 weeks. Track CTR and conversion. Document what works.
Control Frequency and Preferences
Frequency mistakes drive opt-outs faster than weak copy. When possible, let subscribers choose how often they hear from you. Preference centers reduce churn and extend list lifespan. If opt-outs rise above 0.5%, reduce frequency before changing messaging.
What’s a “Good” SMS Open Rate Target for Your Business?
There is no meaningful “open rate target” for SMS marketing. If you’re setting goals based on open rate, you’re optimizing a metric that can’t be reliably measured.
Instead, SMS targets should be set based on what you want the message to achieve.

Source: Vecteezy
Choose Targets Based on Your Goal
Different goals require different metrics:
- Driving clicks:
Target a 5–15% click-through rate - Driving conversions:
Target a 2–5% conversion rate - Driving engagement or conversation:
Target a 10–20% reply rate
These metrics are measurable, comparable, and tied to real user behavior.
Establish Your Baseline Before Chasing Benchmarks
Industry benchmarks provide context—not direction.
Run 2–3 campaigns and measure your actual results:
- CTR
- Conversion rate
- Revenue per message
Your baseline might be 8% CTR and 3% conversion. That’s not “good” or “bad.” It’s your starting point. From there, test changes and track improvement against your own data.
Know When Benchmarks Mislead You
Benchmarks hide important differences.
A luxury brand may see lower CTR but higher conversion. A discount retailer may see higher CTR but thinner margins.
Comparing your results to generic averages often leads to the wrong conclusions. Compare performance against your own past campaigns instead.
The Only Target That Really Matters
If you need a single number to anchor decisions, use revenue per message. If RPM increases over time, your SMS program is improving—regardless of what any open rate claim suggests.
Closing Thoughts
SMS open rate is a marketing fiction. It’s built on delivery estimates and industry assumptions—not real engagement data.
What actually matters is measurable behavior: delivery reliability, clicks, replies, conversions, and revenue per message. These metrics tell you whether your SMS campaigns are earning attention and driving results.
If you can track those signals consistently, you don’t need an “open rate” at all—you already know what’s working.
If your current SMS setup doesn’t give you clear visibility into delivery, engagement, and revenue impact, it may be time to rethink your tooling. Platforms like SMS Boosting focus on measurable performance metrics, not inflated open-rate claims—so decisions are based on real data, not assumptions.
FAQs
Why do people keep saying SMS has a 98% open rate?
Because “98% open rate” is usually a delivery estimate, not proof that messages were actually read. SMS has no open tracking like email, so the number is based on assumptions, not measurement.
Can I track SMS opens with links or special codes?
No. You can track clicks on links (CTR), replies, and conversions—but you can’t know how many people read an SMS without clicking. That limitation is built into how SMS works.
Is 10% CTR good for SMS?
Yes. For most industries, 5–15% CTR is healthy. Around 10% or higher usually means your list is engaged and your offer is relevant. Always judge CTR by use case, not generic benchmarks.
How often should I send SMS to avoid high opt-out rates?
Start with 1–2 messages per week for engaged subscribers. Monitor opt-out rate closely. If it rises above 0.5%, reduce frequency. Different audiences tolerate different send rates, so test and adjust.