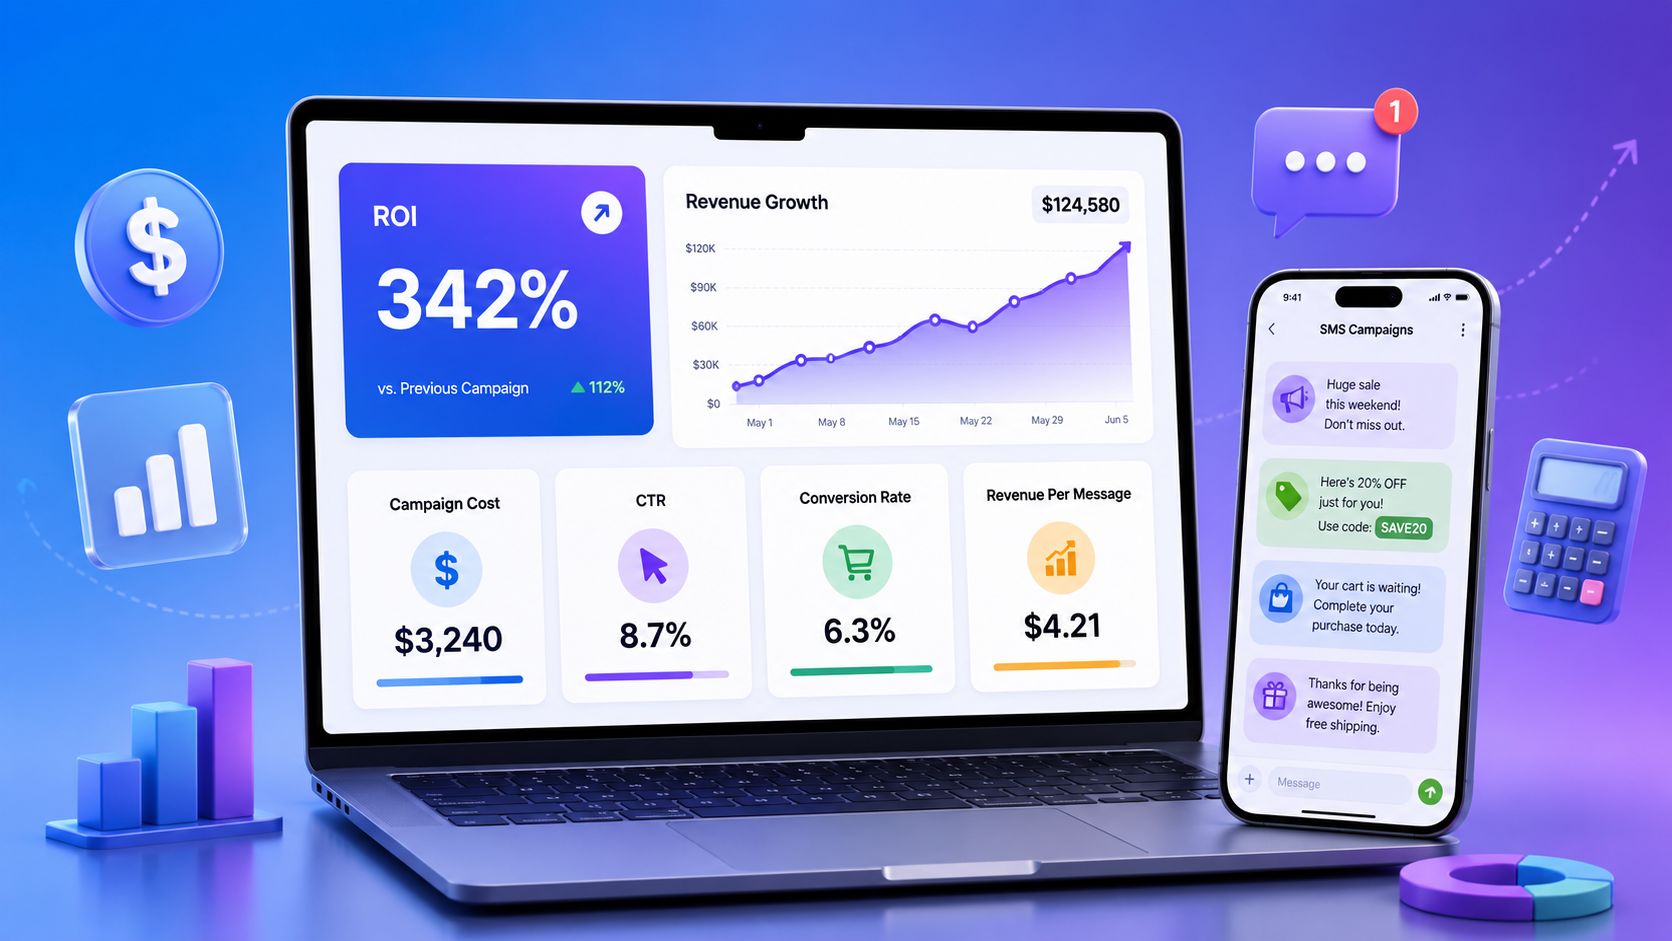
SMS marketing delivers one of the highest ROIs of any digital channel — but only if you know how to measure it correctly. The basic formula is: ROI = (Revenue Generated − Total Campaign Cost) ÷ Total Campaign Cost × 100. For example, spend $400 on a campaign, generate $2,800 in revenue, and your ROI is 600%. Get that number right, and you’ll know exactly whether your SMS spend is paying off — or quietly bleeding your budget.
To make this easier, we’ve built an SMS ROI Calculator below. Enter your campaign cost, revenue, and key performance data — it instantly calculates your ROI alongside metrics like Delivery Rate, CTR, Conversion Rate, Revenue Per Message (RPM), and Cost Per Conversion, giving you a complete picture of campaign performance.
SMS Marketing ROI Calculator
What Is SMS Marketing ROI?
SMS marketing ROI is the financial return you get from running text message campaigns relative to what you spent on them. In plain terms, it answers one question: for every dollar you put into SMS marketing, how many dollars came back?
This sounds simple, but it trips up a lot of marketers. ROI isn’t just about revenue. It’s about net return — meaning you have to subtract every cost involved in running the campaign before you can call a number your ROI. Platform fees, message costs, list-building expenses, the time your team spent writing copy — all of it counts.
SMS marketing has a reputation for strong returns. According to Klaviyo’s 2023 SMS benchmark report, brands using SMS marketing see an average ROI of around $71 for every $1 spent in high-performing campaigns. But averages don’t tell your story. Your ROI depends on your industry, your list quality, your offer, and — critically — how accurately you’re tracking everything. That’s what this guide is about.
How Do You Calculate SMS Marketing ROI?
Calculating SMS marketing ROI isn’t complicated once you break it into four clear steps. The tricky part isn’t the math — it’s making sure the inputs going into that math are accurate.
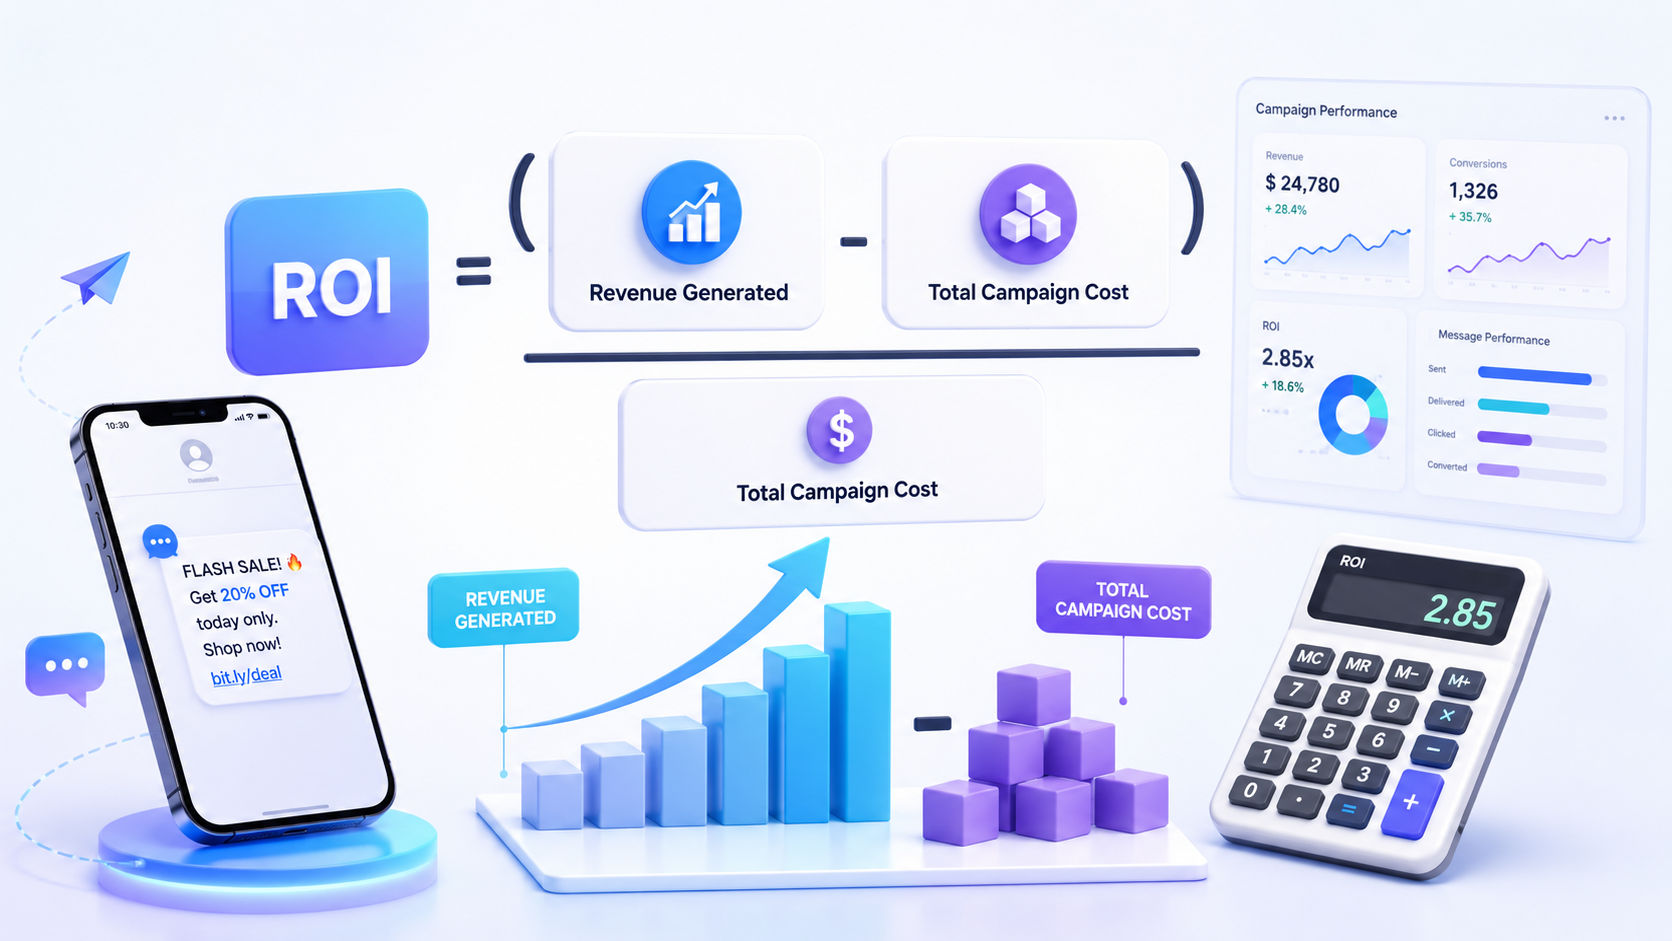
The Core ROI Formula
Here’s the formula every SMS marketer should have memorized:
ROI (%) = [(Revenue from Campaign − Total Campaign Cost) ÷ Total Campaign Cost] × 100
For example: if a campaign generated $8,000 in revenue and cost $500 to run, your ROI would be:
($8,000 − $500) ÷ $500 × 100 = 1,400% ROI
That’s a real number you can put in front of a client or a CFO. But it only holds up if the revenue and cost figures are accurate — which is where most people go wrong.
Define the Campaign Goal and Tracking Window
Before you run a single calculation, you need to define two things: what counts as a “win” for this campaign, and how long you’ll track it.
Your campaign goal might be a completed purchase, a form submission, a booked appointment, or a coupon redemption. Whatever it is, define it before you send — not after. Post-hoc goal-setting is how marketers accidentally inflate their numbers.
Your tracking window is the period of time after a message is sent during which you’ll credit conversions to that campaign. SMS typically drives fast action — most responses happen within 1 to 3 hours of delivery. A 24 to 72-hour attribution window is standard for promotional campaigns. For nurture sequences or cart abandonment flows, 7 days is more appropriate.
What to Include in Total Campaign Cost
This is where most ROI calculations fall apart. People count the cost of sending messages and stop there. But total campaign cost should include:
- SMS Platform Fees: Your monthly subscription or per-message rate from your provider
- Message Send Costs: The per-SMS or per-MMS cost for the actual sends
- List Acquisition Costs: Any ad spend or incentive costs used to grow your subscriber list
- Content Creation: Copywriting time, creative assets, or agency fees
- Integration and Tech Costs: Any developer time or tool costs for connecting your SMS platform to your CRM or e-commerce store
- Compliance and Legal: Opt-in management tools, legal review if applicable
If you’re running SMS in-house with an existing platform and subscriber list, your marginal cost per campaign might be low. But if you’re building from scratch, those upfront costs need to be amortized across campaigns.
Direct vs. Indirect Revenue
Not all revenue from SMS is equal — or equally easy to measure.
Direct revenue is the cleanest: a customer clicks your SMS link, lands on a product page, and buys. You can trace that transaction end-to-end.
Indirect revenue is trickier. A customer receives your SMS, doesn’t click, but visits your site three days later and buys. Did the SMS cause that? Maybe. That’s where attribution modeling comes in — which we’ll cover in detail later.
For ROI calculations, it’s safest to start with direct revenue only. Once you have a solid attribution setup, you can layer in assisted conversions. But mixing direct and indirect revenue without a clear methodology will give you numbers that look great on paper and mean nothing in practice.
What Metrics Should You Track to Measure SMS ROI?
ROI is the headline number, but it’s built from a stack of smaller metrics. Track these consistently, and you’ll always know why your ROI is what it is — not just what it is.
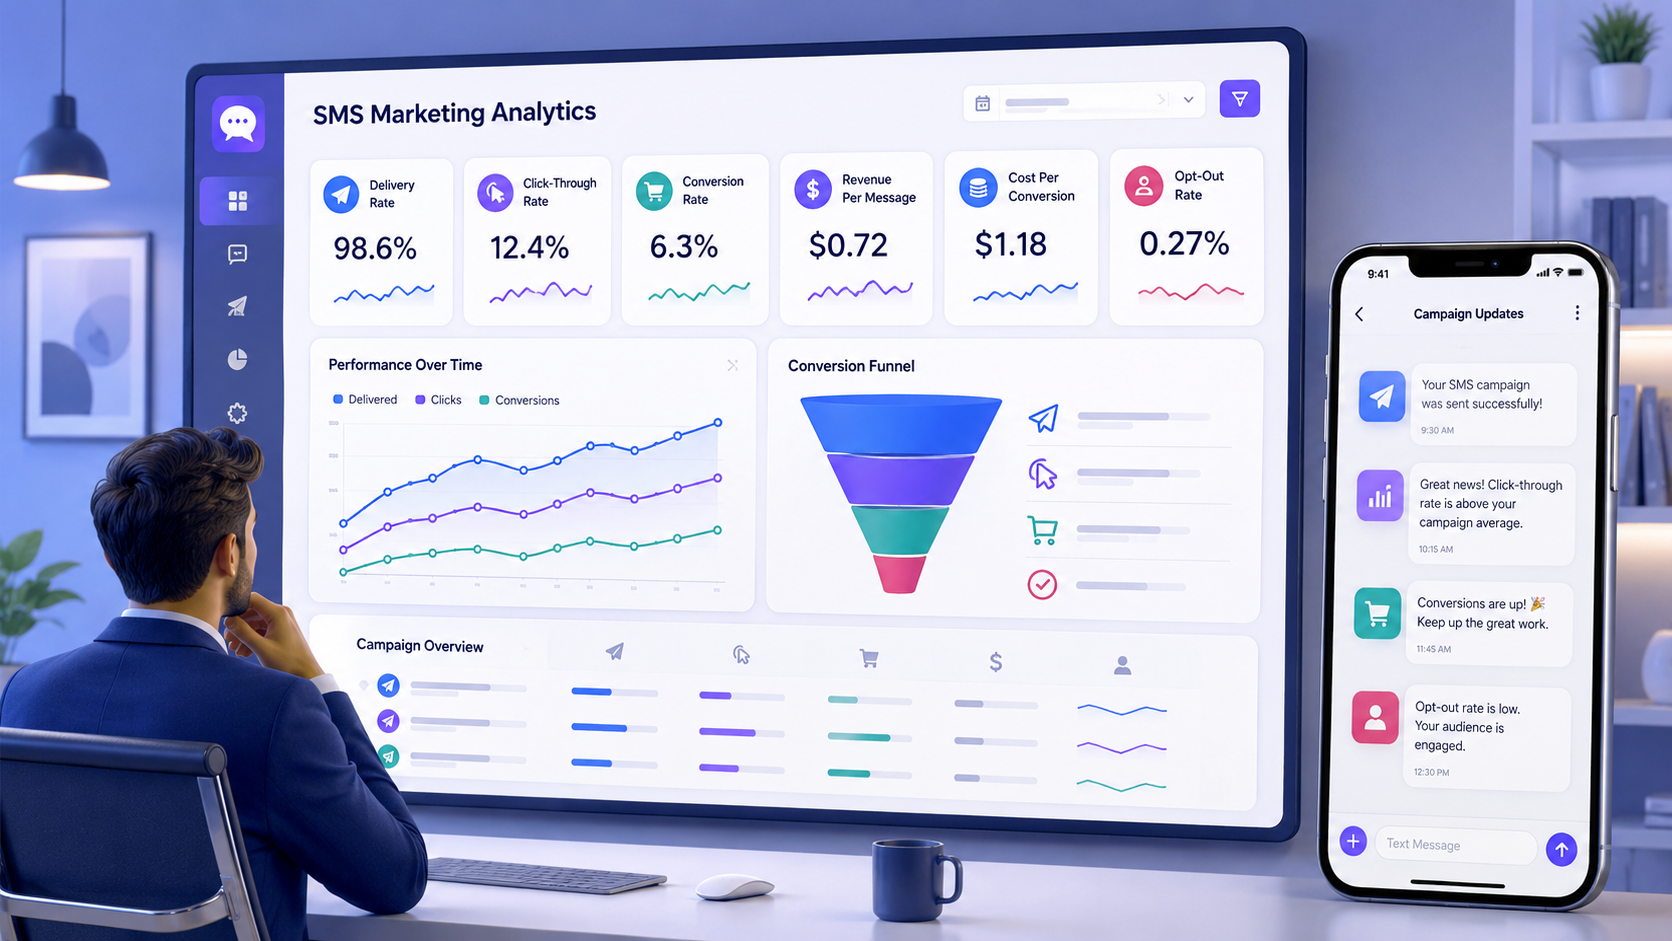
Delivery Rate
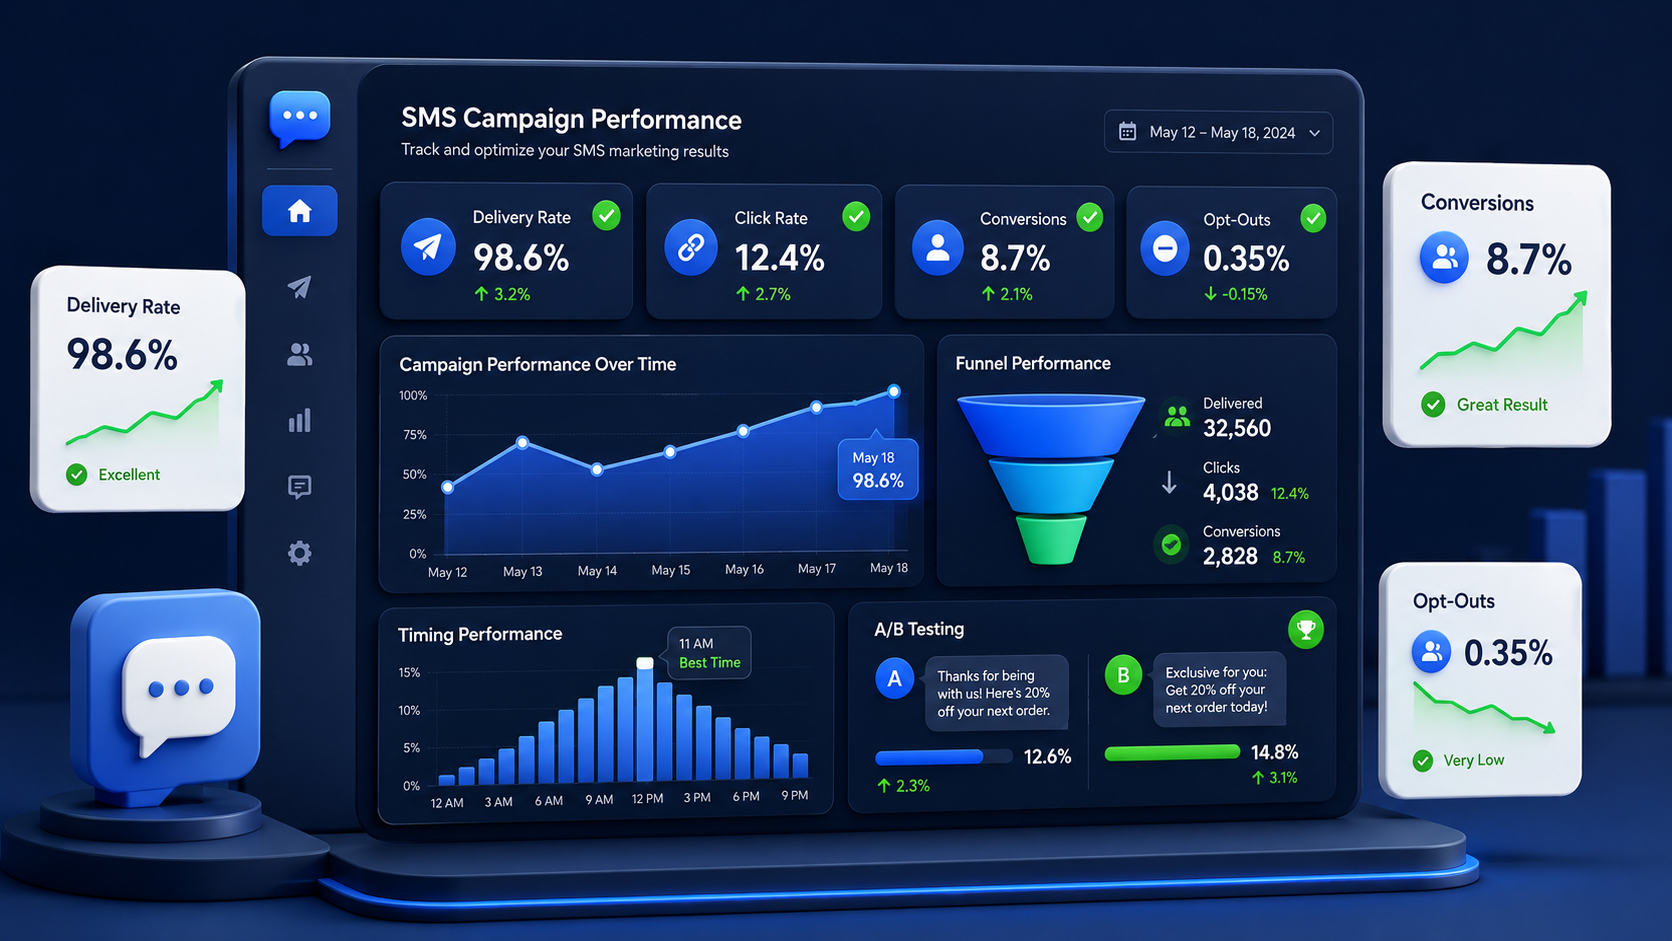
Delivery rate is the percentage of messages successfully delivered to recipients: (Messages Delivered ÷ Messages Sent) × 100. A healthy delivery rate is 95% or above. Anything lower signals problems with list quality — invalid numbers, carrier filtering, or compliance issues. If your messages aren’t arriving, nothing else in your funnel matters.
Click-Through Rate (CTR)
CTR measures how many recipients clicked a link in your message: (Clicks ÷ Messages Delivered) × 100. SMS CTR benchmarks vary by industry, but a rate of 8% to 25% is considered strong. Email CTR typically sits around 2% to 5% by comparison. The gap exists because SMS lands in a more personal space — people actually read their texts.
Conversion Rate
Conversion rate is the percentage of people who clicked and then completed your desired action: (Conversions ÷ Clicks) × 100. This metric tells you whether your landing page and offer are doing their job. A high CTR with a low conversion rate means people are interested but something’s breaking down after the click — usually the landing page experience or the offer itself.
Revenue Per Message (RPM)
RPM tells you how much revenue each individual message generated on average: Total Revenue ÷ Total Messages Sent. If you sent 10,000 messages and generated $3,000 in revenue, your RPM is $0.30. This is one of the most useful benchmarks for comparing campaigns over time — it normalizes for list size and lets you see whether your messaging is getting more or less effective.
Cost Per Conversion
Cost per conversion is how much you spent to generate each sale or action: Total Campaign Cost ÷ Total Conversions. This metric is especially useful when comparing SMS to other channels. If your SMS cost per conversion is $4 and your paid social cost per conversion is $22, that’s a compelling case for shifting budget.
Opt-Out Rate
Opt-out rate is the percentage of recipients who unsubscribed after receiving your message: (Opt-Outs ÷ Messages Delivered) × 100. An opt-out rate above 1% is a warning sign. It usually means you’re sending too frequently, your content isn’t relevant, or your audience wasn’t properly opted in. High opt-out rates don’t just hurt your current campaign — they permanently shrink your list and damage future ROI.
How Do You Attribute Revenue to an SMS Campaign?
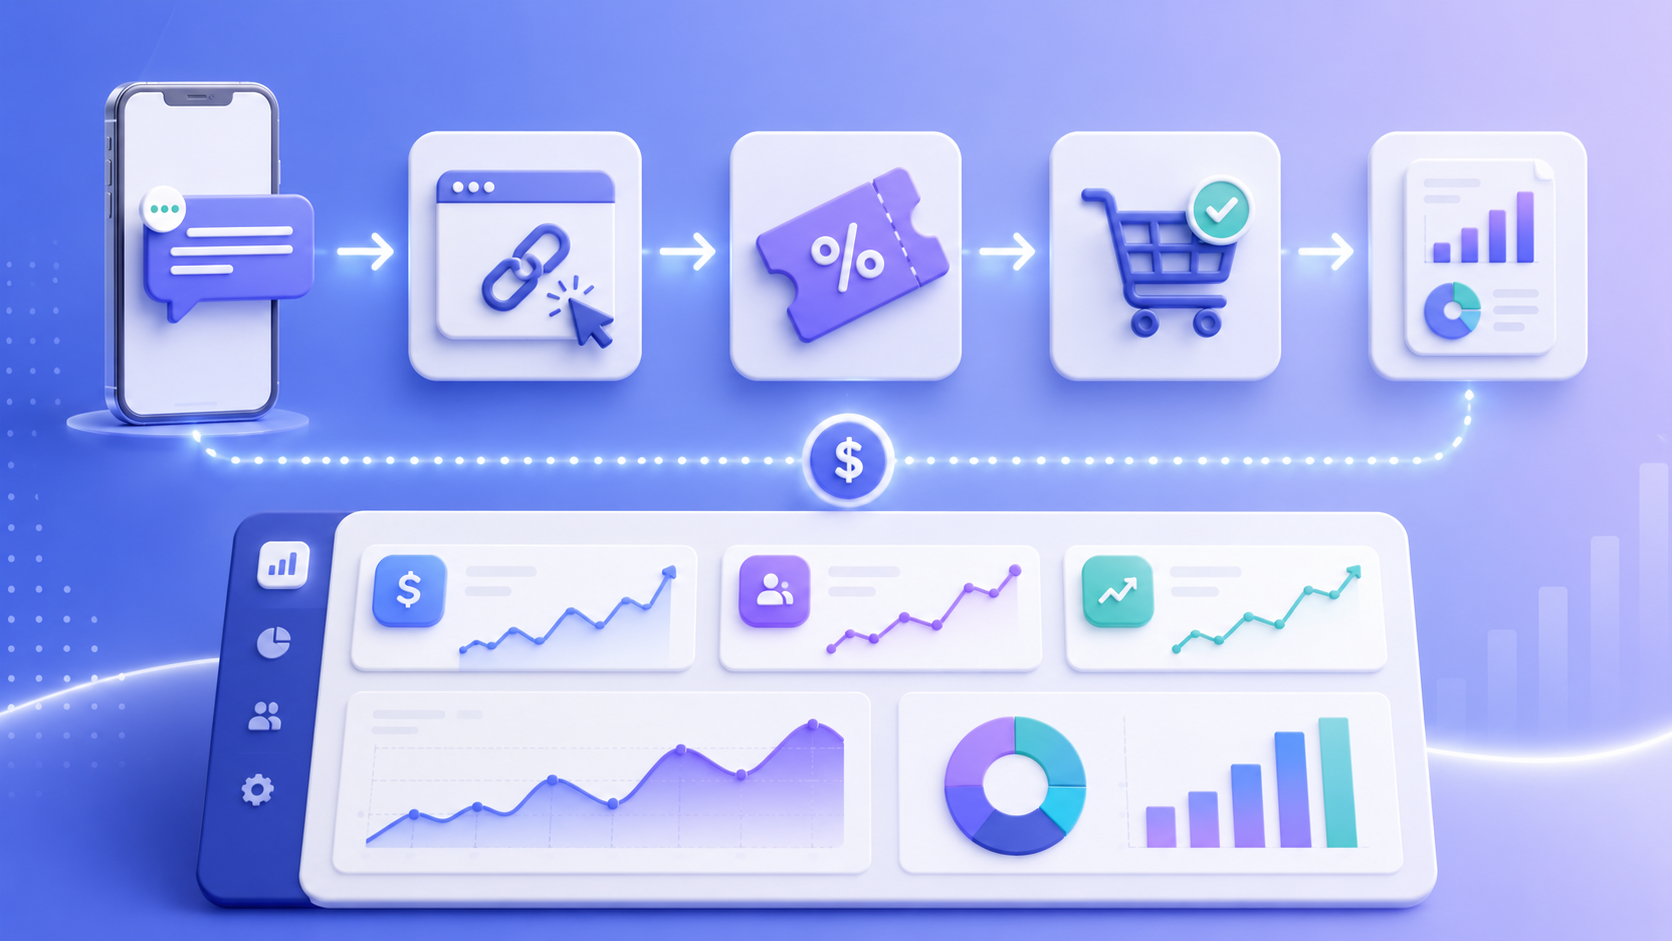
Attribution is the process of connecting a sale back to the marketing touchpoint that influenced it. For SMS, there are five main methods — each with its own strengths and trade-offs.
Unique Promo Codes
This is the most reliable attribution method for promotional campaigns. You assign a unique discount code to each SMS campaign — say, SUMMER20 — and track how many times it’s redeemed. The beauty of this approach is that it works even when customers don’t click a link. They might see the code in the text, remember it, and use it later on desktop. Promo code attribution captures that behavior where UTM tracking would miss it entirely.
UTM Parameters
UTM parameters are tags you add to URLs in your SMS messages. When someone clicks the link, your analytics platform records the source, medium, and campaign name. A properly tagged SMS link might look like:
yourstore.com/sale?utm_source=sms&utm_medium=text&utm_campaign=summer_promo
This method gives you granular data on post-click behavior — what pages people visited, how long they stayed, and whether they converted. The limitation is that it only captures clicks, not offline or direct-visit conversions.
Dedicated Landing Pages
Creating a landing page that’s only accessible via your SMS link is another clean attribution method. If someone lands on that page, they came from your SMS — no guesswork. This works especially well for flash sales or limited-time offers where you want a controlled, distraction-free experience anyway. The downside is the extra setup time required for each campaign.
Multi-Touch Attribution
Most customers don’t convert on a single touchpoint. They might see a Facebook ad, open an email, receive an SMS, and then buy. Multi-touch attribution models assign partial credit to each touchpoint in that journey. Here’s how the main models compare:
| Model | How Credit Is Assigned | Best For |
| First-Touch | 100% credit to the first interaction | Measuring awareness campaigns |
| Last-Touch | 100% credit to the final interaction before conversion | Measuring direct-response campaigns |
| Linear | Equal credit split across all touchpoints | Balanced multi-channel view |
| Time-Decay | More credit to touchpoints closer to conversion | SMS as a final-nudge channel |
For SMS, a time-decay or linear model tends to be most accurate, since SMS often acts as the final nudge in a longer customer journey.
Attribution Window
The attribution window defines how long after a message is sent you’ll credit a conversion to that campaign. Set it too short and you’ll undercount revenue. Set it too long and you’ll accidentally credit conversions that had nothing to do with your SMS.
For promotional SMS blasts, a 24 to 48-hour window is standard. For automated flows like cart abandonment or win-back sequences, 5 to 7 days is more appropriate. Document your window clearly so your ROI numbers stay consistent across campaigns.
What Is a Good SMS Marketing ROI Benchmark?
A “good” SMS marketing ROI depends heavily on your industry, offer type, and list quality — but here are the numbers most marketers use as reference points.
Across industries, a positive ROI starting at 200% to 500% is considered a solid baseline for SMS campaigns. That means for every $1 spent, you’re getting $3 to $6 back. High-performing e-commerce brands regularly report ROI in the range of 500% to 2,000% on well-targeted promotional campaigns.
| Industry | Typical SMS ROI Range |
| E-commerce / Retail | 500% – 2,000%+ |
| Restaurants & Food | 300% – 800% |
| Health & Wellness | 200% – 600% |
| B2B / Services | 100% – 400% |
| Real Estate | 150% – 500% |
A few important caveats. These numbers reflect campaign-level ROI and don’t account for the full cost of building and maintaining a subscriber list. They also assume a reasonably healthy list with proper segmentation. A poorly maintained list with high opt-out rates will drag these numbers down significantly.
If you’re just starting out, don’t benchmark against the top end of these ranges. A 200% ROI on your first campaign is genuinely excellent. Focus on improving your metrics incrementally — better segmentation, stronger offers, smarter timing — and the ROI will follow.
What Tools Do You Need to Track SMS Marketing ROI?
You don’t need an enterprise tech stack to track SMS ROI accurately. But you do need the right tools in place before you send your first message.
- SMS Platform with Built-In Analytics: Your SMS provider should give you delivery rates, CTR, opt-out rates, and revenue attribution natively. If it doesn’t, that’s a problem. Look for platforms that integrate directly with your e-commerce or CRM system.
- Google Analytics 4 (GA4): Use GA4 to track post-click behavior via UTM parameters. Set up conversion events for purchases, form submissions, or whatever your campaign goal is.
- E-commerce Platform (Shopify, WooCommerce, etc.): If you’re running an online store, your e-commerce platform is where promo code redemptions and revenue data live. Make sure your SMS platform integrates with it.
- CRM System: For B2B or service businesses, a CRM like HubSpot or Salesforce lets you track how SMS touchpoints influence deals through the pipeline.
- Spreadsheet or Reporting Dashboard: Even a well-structured Google Sheet can serve as your ROI tracking hub. Log campaign costs, revenue, and key metrics after every send. Over time, this becomes an invaluable performance database.
The most common mistake here isn’t using the wrong tools — it’s not connecting them. Your SMS platform, analytics tool, and e-commerce system need to talk to each other. Without that integration, you’re manually reconciling data across three platforms and hoping the numbers line up.
Real-World SMS ROI Calculation: A Full Example
Let’s walk through a complete, realistic SMS ROI calculation from start to finish.
Scenario: An online clothing retailer runs a 48-hour flash sale campaign targeting their existing SMS subscriber list with a 30% off promo code: FLASH30.
Campaign Inputs:
| Item | Detail |
| List size | 8,000 subscribers |
| Platform cost (prorated) | $120 |
| Per-message cost ($0.01 × 8,000) | $80 |
| Copywriting (2 hrs × $50/hr) | $100 |
| Total Campaign Cost | $300 |
Campaign Results (tracked over 48 hours):
| Metric | Result |
| Delivery Rate | 97% → 7,760 delivered |
| Click-Through Rate | 18% → 1,397 clicks |
| Conversion Rate | 12% → 168 purchases |
| Average Order Value | $65 |
| Total Revenue Attributed | $10,920 |
ROI Calculation:
($10,920 − $300) ÷ $300 × 100 = 3,540% ROI
Revenue Per Message: $10,920 ÷ 8,000 = $1.37 per message
Cost Per Conversion: $300 ÷ 168 = $1.79 per sale
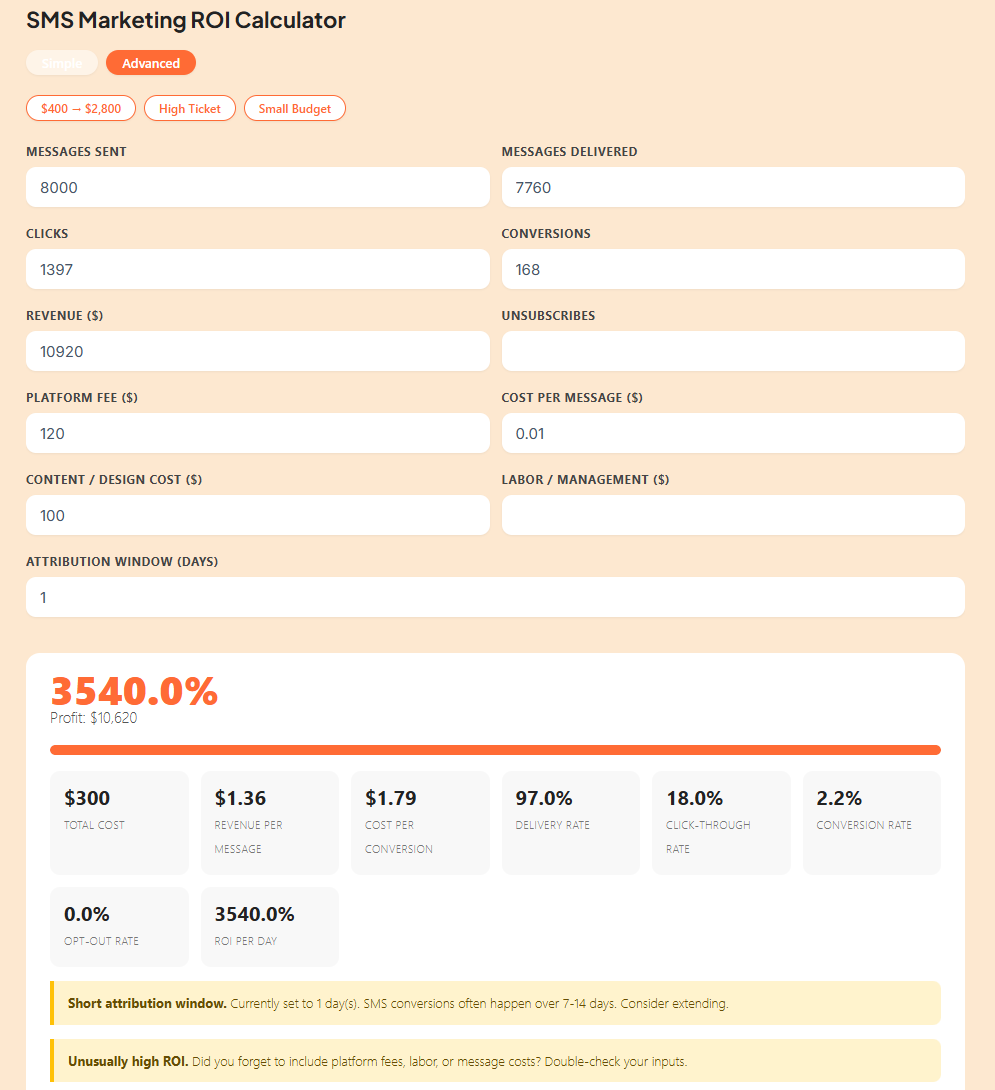
This is a realistic result for a well-executed SMS marketing for ecommerce campaign with a healthy list and a compelling offer. The numbers aren’t magic — they’re the product of a clean list, a strong discount, and proper tracking in place before the campaign went out.
Now flip the scenario: same campaign, but the list hasn’t been cleaned in 18 months. Delivery rate drops to 78%, CTR falls to 9%, and conversion rate dips to 7%. Suddenly you’re looking at 43 conversions, $2,795 in revenue, and an ROI of 832% — still positive, but less than a quarter of what it could have been. List quality is that impactful.
What Mistakes Can Make SMS Marketing ROI Look Inaccurate?
Getting the ROI formula right is one thing. Making sure the data going into it is honest is another. These four mistakes are the most common ways SMS ROI numbers end up misleading.
Counting Revenue Without Costs
This one sounds obvious, but it happens constantly — especially in smaller teams where the person running SMS campaigns isn’t the same person doing the accounting. Revenue gets reported, costs get forgotten, and suddenly a campaign looks like a home run when it barely broke even. Always document your full cost breakdown before a campaign goes out so there’s no debate after the fact about what should or shouldn’t be included.
Using Too Short an Attribution Window
Setting a 1-hour attribution window on a campaign that drives considered purchases is a guaranteed way to undercount your revenue. Not every customer buys immediately — some receive your SMS, think about it, and convert 36 hours later. Match your attribution window to your typical customer purchase cycle. For impulse buys, 24 hours is fine. For higher-ticket items or service bookings, extend it to 5 to 7 days.
Mixing Campaign SMS and Automated SMS
Promotional blast campaigns and automated flows — like abandoned cart reminders or welcome sequences — have fundamentally different cost structures and conversion dynamics. Blending their revenue and costs into a single ROI number produces a figure that accurately represents neither. Track them separately. Your welcome series ROI will look different from your flash sale ROI, and that’s fine — they’re doing different jobs.
Ignoring Unsubscribes and List Quality
A campaign that generates $5,000 in revenue but causes 400 unsubscribes has a hidden cost that doesn’t show up in your ROI calculation: the lifetime value of those 400 subscribers you just lost. If your average subscriber generates $15 in revenue per year, that’s $6,000 in future revenue gone. Factor list health into your ROI thinking — a campaign with a 0.3% opt-out rate is worth far more over time than one with a 2.5% opt-out rate, even if the short-term revenue looks similar.
Final Thought
Measuring SMS marketing ROI doesn’t require a data science degree. It requires a clear formula, honest cost accounting, the right attribution setup, and consistent tracking across every campaign. Here are the five things to take away from this guide:
- Use the right formula: ROI = (Revenue − Cost) ÷ Cost × 100. Include every cost, not just message fees.
- Track the metrics that build your ROI story: Delivery rate, CTR, conversion rate, RPM, cost per conversion, and opt-out rate all tell you why your ROI is what it is.
- Choose an attribution method that fits your business: Promo codes for simplicity, UTM parameters for depth, multi-touch models for complex journeys.
- Set realistic benchmarks: A 200% to 500% ROI is a solid starting point. High-performing campaigns regularly exceed 1,000%.
- Protect your list: Opt-out rates and list quality have a compounding effect on long-term ROI that short-term revenue numbers will never fully capture.
If you’re running sms marketing campaigns and not tracking ROI systematically, you’re flying blind. The good news? With the framework in this guide, you can fix that before your next send.
Frequently Asked Questions About How to Measure ROI of SMS Marketing
How long does it take to see measurable ROI from SMS marketing?
Most businesses see measurable ROI from their very first promotional campaign, often within hours of sending. That said, building a list large enough to generate statistically reliable data typically takes 3 to 6 months of consistent list-building effort.
How do you measure SMS ROI for a service business or B2B company?
Tie SMS ROI to pipeline value rather than direct revenue. Track how many booked consultations, demo requests, or qualified leads a campaign generates, then apply your average close rate and deal value to estimate pipeline ROI. A CRM with UTM tracking makes this straightforward.
Does list size affect how reliable your SMS ROI numbers are?
Yes. With fewer than 500 subscribers, a single large order can skew your entire ROI figure. You generally need 1,000 to 2,000 active subscribers before campaign data becomes stable enough to make confident optimization decisions.
Should you count repeat purchases in SMS marketing ROI?
Only if they fall within your defined attribution window and were directly influenced by that campaign touchpoint. For measuring the long-term value of your SMS program as a whole, comparing repeat purchase rates between SMS subscribers and non-subscribers is a more meaningful approach.
Why does SMS ROI look high when total revenue is still low?
ROI is a ratio, not an absolute number. A $50 campaign generating $400 in revenue is 700% ROI — but only $350 in net profit. High ROI with low revenue means your strategy is working but your list is too small. Keep doing what’s working and focus on scaling your subscriber base.